Reports
Sales, fulfillment speed, patient growth, and staff activity over a date range you choose, with drill-downs and CSV exports.
Reports is the Client Admin's read-only view of sales, fulfillment speed, patient growth, and staff activity, in three sections over a date range you choose.
Questions people ask about this page
Why does Total patients here not match my Dashboard?
Because they count different people. The Dashboard tile says so under the number — "All patient records, incl. test accounts". Reports excludes test accounts from every metric. If the two numbers differ, the gap is your test records. Two Reports metrics are the exception and do not filter test data: Payment failures and Active patients (last 30 days).
Why does Total patients not change when I change the date range?
It is a running total. Its sub-line reads "As of today." and its tooltip says "A running total that doesn't change with the date range." The same is true of Active prescriptions. New patients is the range-bounded one.
What counts as an "active" patient?
Someone who signed in to the portal at least once in the last 30 days. It is not about orders, and it ignores the date range you picked — the sub-line reads "Last 30 days."
What is actually in the CSV?
The header button is labelled Export orders (CSV) and that is literally what it exports: your paid orders in the selected range, with the columns Paid, Patient, Product, Type, Amount, Payment. It is not a dump of the tiles. Two tables have their own separate export icon — Sales by product and Staff activity.
Why is a turnaround tile blank?
It reads Not available when nothing in the range qualifies. That is deliberate: the server returns nothing rather than a misleading zero. Avg time to delivery also carries the note "Accrues after launch as deliveries complete."
Which numbers can I click into?
Any tile showing a View records control. That is Paid sales, Net revenue, Paid orders, Refund rate, Payment failures, Refills, Active prescriptions, Total patients, and New patients. Average order value, the four turnaround tiles, and Active patients (last 30 days) have no drill-down.
What timezone are the dates in?
Eastern. The line beside the date presets reads "Updated {age} · All dates ET". A range that looks like your local calendar day may not be one.
Is this live?
Near-live, and the page tells you how stale it is: "Updated just now", "Updated 4m ago", and so on. If a background refresh fails you get "Couldn't refresh — showing recent data." Use the refresh control, labelled Refresh reports, to force a reload.
Where to find it
Left menu → Reports. Direct link: /reports. Visible to: Client Admin only. Client Staff have no Reports item, and opening /reports as Client Staff shows Reports are not available with the line "Use the available dashboard and workflow pages for account activity." Review Only (gfe_only) Client Admins do keep the page — the commerce sections simply stay empty, because that model has no orders or products.
What is on this page
| What you see | What it does |
|---|---|
| Page heading Reports | Sub-line: "Sales, fulfillment, patients, and team activity." |
| Export orders (CSV) | Downloads your paid orders for the selected range and product filter. |
| Refresh icon button | Labelled Refresh reports. Forces a reload of every section. |
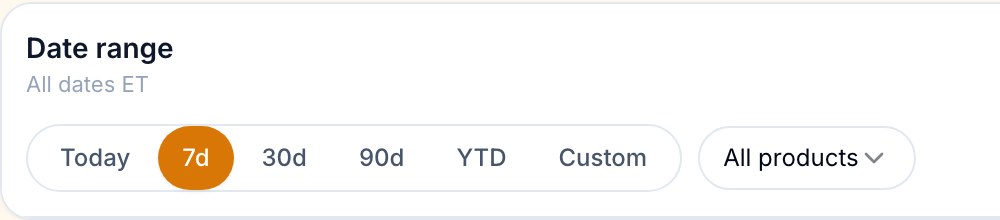
| Card Date range | Holds the presets, the product filter, and the freshness line. |
| Preset pills | Today · 7d · 30d · 90d · YTD · Custom. The group's screen-reader label is Date range preset. |
| Custom range | Choosing Custom reveals from/to date pickers under the presets. |
| Product filter | A dropdown labelled Product, defaulting to All products. It lists up to 200 of your products, alphabetically. |
| Freshness line | "Updated {age} · All dates ET", plus "Couldn't refresh — showing recent data." when a background refresh failed. |
| Three sections | Sales & revenue, Fulfillment & turnaround, Patients & team. |
| Drill-down panel | Opens from a tile's View records. Card Records, sub-line "Records behind the selected metric", with Previous page and Next page controls. |
| First-run banner | On a brand-new account: "Your reports are ready — they're waiting on your first activity." with a button Open products. |
| Panel error | "Couldn't load these metrics." on a section that failed. |
Section 1 — Sales & revenue
Described as "Paid orders, refunds, product performance, and coupon usage."
Tiles
| Metric | What it counts | Drill-down |
|---|---|---|
| Paid sales | "Total value of paid orders before refunds, in the selected date range." | View records → your paid orders. |
| Net revenue | "Paid sales minus refunds in the selected range." | View records → the refunded orders behind the deduction. |
| Average order value | "Average value of each paid order." | None. |
| Paid orders | The count of paid orders in range. | View records → those orders. |
| Refund rate | "Refunds as a share of paid sales in the selected date range." Lower is better, and the comparison arrow is coloured accordingly. | View records → refunded orders. |
| Payment failures | "Order payments that failed in the selected date range. Counts order-linked failures only — checkout attempts that abort before an order exists aren't captured." | View records → the failures. |
Charts and tables
| Panel | What it shows |
|---|---|
| Paid sales over time (area chart) | Paid sales per day across the selected range. Sub-line: "Daily activity for the selected date range." |
| Sales by product (table) | "Paid orders, gross revenue, refunds, and first/last sale per product in the selected range." Columns: Product, Paid orders, Gross revenue, Refunds, First sale, Last sale. Searchable, with its own CSV export. Empty: "No paid orders in this range — share a product link to get your first sale." |
| Coupon usage (ranked bars) | Redemptions per promo code, ranked. Empty: "No coupon redemptions in this range." Note this sits in Sales & revenue, not in the patients section. |
There is no "Top products" panel. It was replaced by Sales by product, which shows the same paid-in-range basis with more columns and its own export.
Section 2 — Fulfillment & turnaround
Described as "Order progress, delivery timing, and prescription turnaround."
Tiles
| Metric | What it counts | Drill-down |
|---|---|---|
| Avg time to delivery | "Average time from a paid order to delivery." Sub-line: "Accrues after launch as deliveries complete." | None. |
| Avg time to claim | "Average wait from submission to a provider claiming the review, over async reviews claimed in the selected range. Submission time is the review's creation time." This is how long your patients wait for the network to pick work up. | None. |
| Avg claim to decision | "Average time from a provider claiming a review to the clinical decision, over decisions made in the selected range for your patients. Includes approvals and denials." | None. |
| Avg claim to prescription | "Average time from claim to the first prescription sent, over async reviews claimed in the selected range that produced a prescription. Reviews without a prescription are excluded." | None. |
| Refills | "Refill orders placed in the selected range." | View records → those orders. |
| Active prescriptions | "Prescriptions that are currently active. A running total that doesn't change with the date range." Sub-line: "As of today." | View records → the prescriptions. |
Panel
Orders in flight — "As of today — every order still moving through fulfillment, regardless of the selected date range (not a conversion funnel)." Rows are lifecycle stages with a count each: Awaiting payment, Awaiting forms, In review, At pharmacy, Shipped, Other in-flight. Stages with nothing in them do not appear. Empty: "No orders in flight right now — new paid orders appear here until they're delivered."
The three claim metrics are the most useful numbers on the page for a conversation with your provider network. Avg time to claim is queue latency — how long work sits before anyone touches it. Avg claim to decision is how fast they work once they start. They are separate problems with separate fixes.
Section 3 — Patients & team
Described as "Patient growth and staff activity for your client account."
Tiles
| Metric | What it counts | Drill-down |
|---|---|---|
| Total patients | "Everyone ever registered as a patient with your brand. A running total that doesn't change with the date range." Sub-line: "As of today." | View records → your patient roster. |
| New patients | "Patient accounts created in the selected date range. Selecting it opens your full patient roster (all time, newest first), so the list total won't match this count." | View records → the full roster, all time. |
| Active patients (last 30 days) | "Patients who signed in to the portal at least once in the last 30 days." Sub-line: "Last 30 days." Ignores the selected range. | None. |
Charts and tables
| Panel | What it shows |
|---|---|
| New patients over time (area chart) | Sign-ups per day across the range. Ignores the product filter. |
| Staff activity (table) | Columns Staff member, Actions, Sessions, Last active. Header note: "Trailing 30 days, regardless of the selected date range." Ignores the product filter. Searchable, with its own CSV export. Empty: "No staff activity in the last 30 days — invite your team from the dashboard." |
How to answer a real question
Open the page
In the left menu, click Reports.
Pick the window
Click 30d, or Custom and set from/to dates. Remember the dates are Eastern.
Narrow to one product if you need to
Use the Product dropdown. It applies to almost everything; New patients over time and Staff activity ignore it.
Read the tile, then click into it
If the tile has View records, click it. A panel slides in with a Records table showing the rows behind the number, paged with Previous page and Next page.
Take the list away with you
Click Export orders (CSV) for the order-level data, or the export icon on Sales by product or Staff activity for those tables specifically.
Every setting on this page
Reports has no saved settings — nothing here persists between visits. These are the view controls.
| Control | What it does | Default |
|---|---|---|
| Today / 7d / 30d / 90d / YTD / Custom | The date window for every range-bounded metric. Comparison arrows measure against the equally long preceding window. | 30d |
| Custom Date range pickers | Explicit from and to dates, shown only when Custom is selected. | — |
| Product dropdown | Narrows to one product. Loading and failure states are shown rather than an empty list. | All products |
| Refresh reports | Reloads every section. Disabled while a request is in flight. | — |
| Export orders (CSV) | Paid orders for the current range and product filter. | — |
| Per-table export icons | On Sales by product and Staff activity only, labelled Export {table} (CSV). | — |
| Per-table search | On Sales by product and Staff activity. | Empty |
| Tile tooltip | The small question-mark control on a tile, labelled What is this?, gives the metric's exact definition. | — |
What is not here: scheduled or emailed reports, saved views, custom metrics, per-provider breakdowns, cost or margin figures, and any way to change what a metric counts.
What the export contains
| Export | Columns | Scope |
|---|---|---|
| Export orders (CSV) (page header) | Paid, Patient, Product, Type, Amount, Payment | Paid orders inside the selected range, honouring the product filter. Dates are written as ISO-8601 timestamps. |
| Sales by product table export | Product, Paid orders, Gross revenue, Refunds, First sale, Last sale | Same range and filter. |
| Staff activity table export | Staff member, Actions, Sessions, Last active | Trailing 30 days regardless of the range. |
On success a toast reads Exported {n} rows. If the build hits the server cap you get a warning instead: "Exported {n} rows. This may be capped — narrow the date range for the full set." A build that takes too long reports "Export timed out. Try narrowing the date range and exporting again."
Statuses you will see here
Reports draws no lifecycle badges. It has display states instead:
| What you see | What it means | What to do |
|---|---|---|
| Not available | Nothing in the range qualified for that metric — most often a turnaround average with no completed cases. | Widen the range. A zero would be a lie, so nothing is shown. |
| Couldn't load these metrics. | One section failed to fetch. | Click Refresh reports. |
| Couldn't refresh — showing recent data. | A background refresh failed, so you are looking at the last good numbers. | Refresh manually; if it persists, open a ticket. |
| Reports are not available | Reporting is not enabled for your account, or your role cannot see it. | Client Staff never see Reports. Otherwise open a ticket. |
| First-run banner | Every number is zero because the account has no activity yet. | Click Open products and share a checkout link. |
| The order payment column in a drill-down | Values such as Paid, Unpaid, Refunded — these are order statuses, not report states. | See Words and statuses. |
What can go wrong
| What you see | Why | Fix |
|---|---|---|
| Reports and the Dashboard disagree on patient count | The Dashboard includes test accounts; Reports excludes them. | Trust Reports for reporting. Delete or archive stale test patients if the gap is confusing. |
| A drill-down list is longer than the number on the tile | Some drill-downs deliberately open a wider list. New patients says so in its tooltip: it opens the full roster, all time, newest first. | Read the tooltip before reconciling counts. |
| Orders in flight ignores your date range | By design — it is an as-of-today snapshot of work in progress, and the panel says so. | Nothing. |
| Staff activity ignores your date range | By design — always trailing 30 days, stated in the header. | Nothing. |
| A product filter changes some panels and not others | New patients over time and Staff activity deliberately ignore it. | Nothing. |
| The export is smaller than you expected | The server caps a single export and warns you when it does. | Narrow the range and export in chunks. |
| A day's revenue lands on the wrong date | All dates are Eastern, not your local timezone. | Use Custom and shift the boundary. |
| Payment failures looks higher than your processor reports | It counts order-linked failures only and, unlike other metrics, does not exclude test accounts. | Drill in and check whether the rows are test records. |
| No Reports item in the left menu | You are signed in as Client Staff. Review Only accounts keep Reports; Client Staff never get it. | Ask a Client Admin for the numbers. |
Next
Was this helpful?